Senior Radiologic Technologist and Technician Salary in Norfolk, NE: $100,634 (2026)
Quick Answer:The top tier of radiologic technologists and technicians working in Norfolk, NE — those at or above the 90th percentile — pull in $100,634/year or more for 2026, based on BLS OEWS 2025 estimates for SOC 29-2034. Strip back Norfolk's price premium (BEA RPP 91.5, 8% below national) and that top-decile pay carries the same buying power as $109,983 in average-cost America. The 40% spread above city median typically rewards 7+ years of practice or specialty credentials.
Based on BLS state-level estimates · View source
In Norfolk, Nebraska, the salary landscape for experienced radiologic technologists and technicians indicates significant earning potential for seasoned professionals. With top-tier pay reaching as high as $100,634 in 2026, those who have honed their skills and built their careers can expect to enjoy a lucrative compensation package. This demonstrates a notable gap between the median annual salary of $71,877 and the figures for top earners, showcasing the value placed on advanced clinical abilities and specialization. Achieving this level of pay requires not only extensive experience, typically exceeding seven years, but also the pursuit of rigorous training, including certifications in specialized areas like CT, MRI, and mammography, which are increasingly in demand.
About the Norfolk Market
Salary estimated from Nebraska average ($66,000) adjusted for local cost of living.
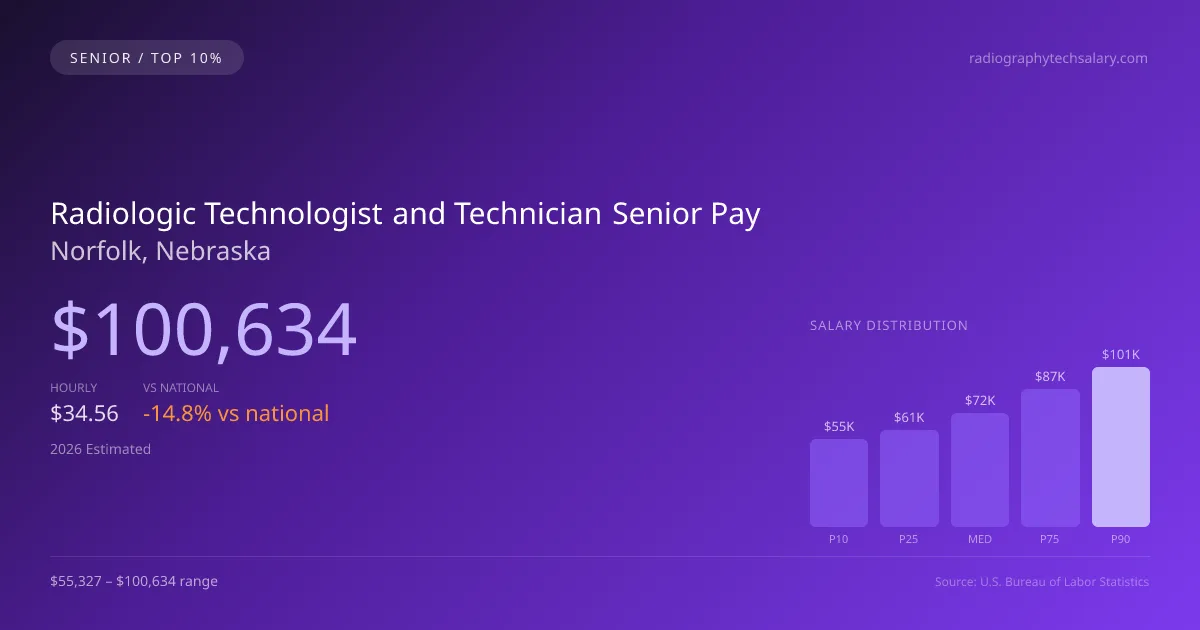
2026 Salary Percentile Distribution in Norfolk
Experienced radiologic technologist and technicians at the top of the pay scale in Norfolk earn between $86,555 and $100,634 per year (2026 est.). This $45,307 range from 10th to 90th percentile reflects significant earnings potential growth over a career. The Norfolk median of $71,877 sits 14.79% below the US median.
Top RT Salary Comparison
| Level | Norfolk | National |
|---|---|---|
| Median (P50) | $71,877 | $84,348 |
| 75th Percentile | $86,555 | $103,974 |
| 90th Percentile (Top 10%) | $100,634 | $124,937 |
In Norfolk, experienced radiologic technologists and technicians (P90) earn 40.01% more than the local median — reflecting the significant value of specialization and tenure in this market.
What Drives Top Radiologic Technologist and Technician Pay in Norfolk
Advanced Certifications in Nebraska
NE radiologic technologists and technicians with additional specialty certifications within the radiologic technology field earn significantly above the $71,877 median. Expanded-scope credentials are increasingly valued by Norfolk employers.
Specialty Focus
Radiologic Technologists and Technicians focusing on high-acuity or specialty areas within the radiologic technology field in Norfolk command premium compensation, often reaching the $86,555–$100,634 range.
Large Health-System & Multi-Site Experience
Large hospital systems and multi-site employers in the Norfolk metro area often pay above-market rates for experienced radiologic technologists and technicians who demonstrate efficiency and leadership.
Employer Loyalty & Patient Relationships
Long-tenured radiologic technologists and technicians in Norfolk with established relationships have strong negotiating leverage. In this developing market, retention bonuses and annual raises are common for top performers.
Continuing Education & Leadership
Radiologic Technologists and Technicians in Nebraska who pursue advanced degrees, mentor junior staff, or lead clinical education programs position themselves for the highest compensation tiers and management roles.
Radiologic Technologist and Technician Career & Wage Growth Path in Norfolk
Clinical Radiologic Technologist and Technician
0-5 yearsSenior/Lead Radiologic Technologist and Technician
5-10 yearsRadiologic Technologist and Technician Department Manager
10+ yearsEducator / Specialty Leadership
AdvancedNorfolk ranks #9 of 13 Nebraska cities for top earner radiologic technologist and technician salary (90th percentile: $100,634).
Top 10% radiologic technologist and technician compensation in Norfolk ($100,634) is 3.51% below the Nebraska average P90 ($104,291).
2019 BLS Actual
$72,300
2025 BLS Actual
$95,578
2026 Current Est.
$100,634
2019–2027 Growth
+46.6%
Salary Trajectory for Radiologic Technologists and Technicians in Norfolk (2019–2027)
2019–2025: actual BLS OEWS data for this metro area. 2026+: CAGR 5.29% projection.
| Year | Annual Salary | Status |
|---|---|---|
| 2019 | $72,300 | Actual |
| 2020 | $74,636 | Actual |
| 2021 | $76,424 | Actual |
| 2022 | $78,888 | Actual |
| 2023 | $82,465 | Actual |
| 2024 | $73,270 | Actual |
| 2025 | $95,578 | Actual |
| 2026(current) | $100,634 | Estimated |
| 2027 | $105,958 | Projected |
Top-earning radiologic technologists and technicians (90th percentile) in Norfolk saw their compensation grow 32.2% from $72,300 in 2019 to $95,578 in 2025, based on 7 years of BLS OEWS data for this metropolitan area. At a 5.29% annual growth rate, senior-level pay is projected to reach $105,958 by 2027, reflecting continued demand for clinical expertise and expanded-function credentials.
Note: Historical values (2019–2025) are actual BLS OEWS figures for the Norfolk metropolitan area, sourced from annual Occupational Employment and Wage Statistics surveys. 2026–2026 figures are current estimates, and 2027 values are projections, calculated using a 5.29% CAGR derived from 7-year BLS historical data. Actual salaries may vary based on employer, experience, certifications, and local market conditions.
Maximizing Your Radiologic Technologist and Technician Earnings in Norfolk
Compensation for senior radiologic technologists and technicians in Norfolk is influenced by varied factors, including specialized skill sets and employer types. For instance, those versed in modalities such as interventional radiology or cardiovascular interventional can command higher rates due to their advanced training and technical expertise. Employment settings also play a role; positions within hospital imaging departments may differ in pay compared to outpatient imaging centers or mobile X-ray companies. Alongside salary, experienced professionals can enhance their earnings through modality cross-training and pursuing advanced credentials, such as ARRT registries. Leadership opportunities are substantial too; many top earners advance to roles like imaging department manager or lead rad tech, unlocking further financial benefits. Additionally, non-salary drivers, like shift differentials or stipends for supervisory positions, contribute to the overall compensation strategy for senior radiologic technologists and technicians in NE.
More salary data for Norfolk, NE:
Frequently Asked Questions
How much do experienced radiologic technologists and technicians make in Norfolk in 2026?
What drives higher radiologic technologist and technician pay in Norfolk?
What certifications boost radiologic technologist and technician salary in Norfolk?
Can experienced radiologic technologists and technicians make six figures in Norfolk?
How much does radiologic technologist and technician salary increase over time in Norfolk?
Related Pages
Compare Salaries
Career Resources
Nearby Cities in Nebraska
Written by Jordan Lee, RT(R), RT(TM)
Career Analyst
Jordan Lee has over 10 years of experience in radiologic technology. They specialize in mammography and work in an outpatient imaging center.
Methodology & Data Source
Top-earner salary figures on this page are 2026 projections derived from the Bureau of Labor Statistics Occupational Employment and Wage Statistics (OEWS) survey, May 2026 release. BLS reported a 90th percentile salary of $95,578 for radiologic technologists and technicians in the Norfolk metro area. A 5.29% compound annual growth rate (CAGR), calculated from 6-year national BLS wage trends, was applied to project current 2026 senior-level compensation. Individual earnings depend on certifications, specialization, practice type, and years of clinical experience.
Data Sources & Methodology
Salary data for Norfolk is estimated from official BLS state-level occupational wage data (2025), adjusted for regional cost-of-living differences using BEA RPP (Regional Price Parities).
2026 figures are projected from 2025 BLS data using a compound annual growth rate (CAGR) of 5.29%, derived from historical BLS wage trends for radiologic technologist and technicians (SOC 29-2034).
Compiled and verified by Jordan Lee, RT(R), RT(TM), a licensed radiologic technologist and technician with 10+ years of clinical experience. · View source data at BLS.gov