Senior Radiologic Technologist and Technician Salary in Richland, WA: $150,605 (2026)
Quick Answer:The top tier of radiologic technologists and technicians working in Richland, WA — those at or above the 90th percentile — pull in $150,605/year or more for 2026, based on BLS OEWS 2025 estimates for SOC 29-2034. Strip back Richland's price premium (BEA RPP 107.4, 7% above national) and that top-decile pay carries the same buying power as $140,228 in average-cost America. The 45% spread above city median typically rewards 7+ years of practice or specialty credentials.
Based on BLS state-level estimates · View source
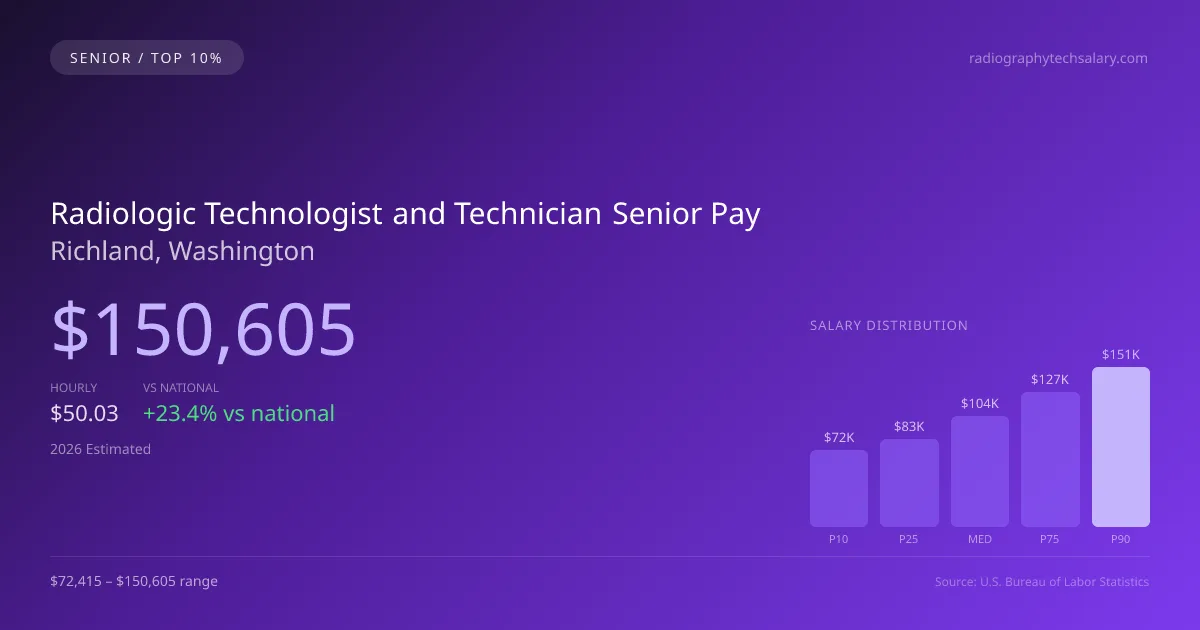
In Richland, the opportunity for top-tier earnings as an experienced radiologic technologist and technician is considerable, with the potential to earn up to $150,605 annually. This figure represents the 90th percentile for the profession, significantly surpassing the national top earning levels. The median annual salary in this area stands at $104,077, illustrating a notable income gap that reflects the premium typically paid to seasoned professionals. To achieve such high salaries, technologists often pursue additional certifications and specializations, which not only enhance their skill sets but also position them strategically within a competitive market.
About the Richland Market
Salary estimated from Washington average ($92,000) adjusted for local cost of living.
2026 Salary Percentile Distribution in Richland
Experienced radiologic technologist and technicians at the top of the pay scale in Richland earn between $126,940 and $150,605 per year (2026 est.). This $78,190 range from 10th to 90th percentile reflects significant earnings potential growth over a career. The Richland median of $104,077 sits 23.39% above the US median.
Top RT Salary Comparison
| Level | Richland | National |
|---|---|---|
| Median (P50) | $104,077 | $84,348 |
| 75th Percentile | $126,940 | $103,974 |
| 90th Percentile (Top 10%) | $150,605 | $124,937 |
In Richland, experienced radiologic technologists and technicians (P90) earn 44.71% more than the local median — reflecting the significant value of specialization and tenure in this market.
What Drives Top Radiologic Technologist and Technician Pay in Richland
Advanced Certifications in Washington
WA radiologic technologists and technicians with additional specialty certifications within the radiologic technology field earn significantly above the $104,077 median. Expanded-scope credentials are increasingly valued by Richland employers.
Specialty Focus
Radiologic Technologists and Technicians focusing on high-acuity or specialty areas within the radiologic technology field in Richland command premium compensation, often reaching the $126,940–$150,605 range.
Large Health-System & Multi-Site Experience
Large hospital systems and multi-site employers in the Richland metro area often pay above-market rates for experienced radiologic technologists and technicians who demonstrate efficiency and leadership.
Employer Loyalty & Patient Relationships
Long-tenured radiologic technologists and technicians in Richland with established relationships have strong negotiating leverage. In this developing market, retention bonuses and annual raises are common for top performers.
Continuing Education & Leadership
Radiologic Technologists and Technicians in Washington who pursue advanced degrees, mentor junior staff, or lead clinical education programs position themselves for the highest compensation tiers and management roles.
Radiologic Technologist and Technician Career & Wage Growth Path in Richland
Clinical Radiologic Technologist and Technician
0-5 yearsSenior/Lead Radiologic Technologist and Technician
5-10 yearsRadiologic Technologist and Technician Department Manager
10+ yearsEducator / Specialty Leadership
AdvancedRichland ranks #11 of 50 Washington cities for top earner radiologic technologist and technician salary (90th percentile: $150,605).
Top 10% radiologic technologist and technician compensation in Richland ($150,605) is 8.98% above the Washington average P90 ($138,189).
2019 BLS Actual
$108,201
2025 BLS Actual
$143,038
2026 Current Est.
$150,605
2019–2027 Growth
+46.6%
Salary Trajectory for Radiologic Technologists and Technicians in Richland (2019–2027)
2019–2025: actual BLS OEWS data for this metro area. 2026+: CAGR 5.29% projection.
| Year | Annual Salary | Status |
|---|---|---|
| 2019 | $108,201 | Actual |
| 2020 | $111,696 | Actual |
| 2021 | $114,373 | Actual |
| 2022 | $118,061 | Actual |
| 2023 | $123,413 | Actual |
| 2024 | $134,160 | Actual |
| 2025 | $143,038 | Actual |
| 2026(current) | $150,605 | Estimated |
| 2027 | $158,572 | Projected |
Top-earning radiologic technologists and technicians (90th percentile) in Richland saw their compensation grow 32.2% from $108,201 in 2019 to $143,038 in 2025, based on 7 years of BLS OEWS data for this metropolitan area. At a 5.29% annual growth rate, senior-level pay is projected to reach $158,572 by 2027, reflecting continued demand for clinical expertise and expanded-function credentials.
Note: Historical values (2019–2025) are actual BLS OEWS figures for the Richland metropolitan area, sourced from annual Occupational Employment and Wage Statistics surveys. 2026–2026 figures are current estimates, and 2027 values are projections, calculated using a 5.29% CAGR derived from 7-year BLS historical data. Actual salaries may vary based on employer, experience, certifications, and local market conditions.
Maximizing Your Radiologic Technologist and Technician Earnings in Richland
Several factors contribute to the robust salary prospects for senior radiologic technologists and technicians in Richland, WA. Specializations such as CT, MRI, and mammography command higher compensation, driven by the complexity and demand for these services. Compensation varies significantly across different employer types; for instance, hospital imaging departments may offer distinct benefits compared to outpatient imaging chains or mobile services. Career advancement opportunities, such as becoming a lead radiologic technologist or imaging department manager, can further enhance earning potential. Additionally, obtaining advanced credentials from JRCERT-accredited programs, along with ARRT registrations in various modalities, can improve salary outcomes. Non-salary incentives, including stipends for leadership roles and differentials for on-call work or trauma center duties, also play a significant role in defining senior radiologic technologist and technician pay in Washington.
More salary data for Richland, WA:
Frequently Asked Questions
How much do experienced radiologic technologists and technicians make in Richland in 2026?
What drives higher radiologic technologist and technician pay in Richland?
What certifications boost radiologic technologist and technician salary in Richland?
Can experienced radiologic technologists and technicians make six figures in Richland?
How much does radiologic technologist and technician salary increase over time in Richland?
Related Pages
Compare Salaries
Career Resources
Nearby Cities in Washington
Written by Jordan Lee, RT(R), RT(TM)
Career Analyst
Jordan Lee has over 10 years of experience in radiologic technology. They specialize in mammography and work in an outpatient imaging center.
Methodology & Data Source
Top-earner salary figures on this page are 2026 projections derived from the Bureau of Labor Statistics Occupational Employment and Wage Statistics (OEWS) survey, May 2026 release. BLS reported a 90th percentile salary of $143,038 for radiologic technologists and technicians in the Richland metro area. A 5.29% compound annual growth rate (CAGR), calculated from 6-year national BLS wage trends, was applied to project current 2026 senior-level compensation. Individual earnings depend on certifications, specialization, practice type, and years of clinical experience.
Data Sources & Methodology
Salary data for Richland is estimated from official BLS state-level occupational wage data (2025), adjusted for regional cost-of-living differences using BEA RPP (Regional Price Parities).
2026 figures are projected from 2025 BLS data using a compound annual growth rate (CAGR) of 5.29%, derived from historical BLS wage trends for radiologic technologist and technicians (SOC 29-2034).
Compiled and verified by Jordan Lee, RT(R), RT(TM), a licensed radiologic technologist and technician with 10+ years of clinical experience. · View source data at BLS.gov