Radiologic Technologist and Technician Salary in Connecticut: $98,270 (2026)
Quick Answer:Across Connecticut's 29 metropolitan areas, the average median radiologic technologist and technician pay sits at $98,270/year heading into 2026 — a figure projected from 2025 BLS OEWS wage data for SOC 29-2034. Because Connecticut sits at BEA RPP 107.9 (8% above the U.S. baseline), that statewide median translates to roughly $91,075 in nationally-comparable purchasing power. Highest-paying metros: Bridgeport ($99,950), Stamford ($98,611), Danbury ($97,859).
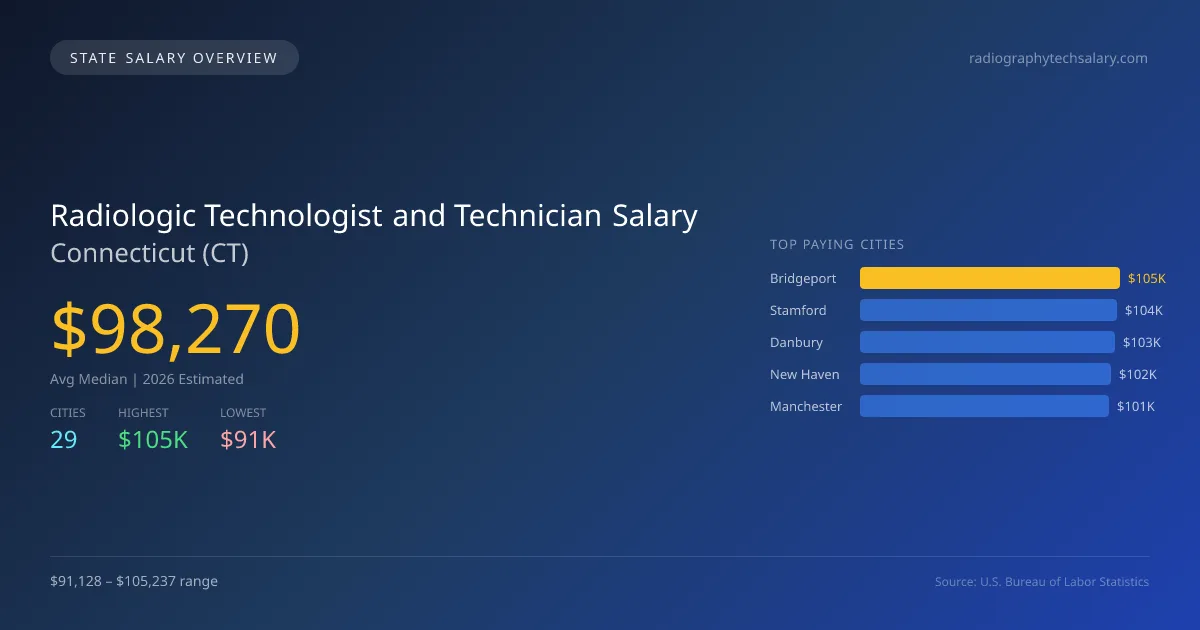
Considering a career in radiologic technology in Connecticut offers substantial financial benefits. As of 2026, the average median salary for radiologic technologists and technicians in Connecticut is projected at $98,269, which is 16.5% higher than the national median of $84,348. Notably, Bridgeport stands out as the highest paying city with a projected salary of $105,237, while Waterbury offers the lowest at $91,128. The significant salary gap of $14,109 between these cities can be attributed to varying cost of living, demand for healthcare services, and local healthcare facility funding. Connecticut has specific state licensing requirements and scope of practice laws, which can influence both the job prospects and earning potential in the field. The state's healthcare environment, coupled with an aging population, drives demand for radiologic services, contributing to an annual growth rate of 5.29%. With a total of 3,310 radiologic technologists and technicians employed across 29 metro areas, cities like Stamford, Danbury, New Haven, and Manchester also provide competitive salaries, with projected earnings of $103,828, $103,036, $101,552, and $100,938 respectively. Overall, the job market for radiologic technology in Connecticut is strong, with a favorable outlook for both new and seasoned professionals.
Connecticut Radiologic Technologist and Technician Salary Range
Overall salary range in Connecticut: $64,921 (lowest entry-level) to $156,587 (highest top earner)
Connecticut vs National Average
Connecticut radiologic technologists and technicians earn 16.51% more than the national median (+$13,922/year difference).
Connecticut Radiologic Technologist and Technician Salary Distribution (2026)
Radiologic Technologist and Technician salaries in Connecticut range from $72,141 (entry-level, 10th percentile) to $126,477 (top earners, 90th percentile), with a median of $98,270. The Connecticut median is $13,922 above the US national median of $84,348. The average hourly rate is $47.24/hr. Approximately 3,310 radiologic technologist and technicians are employed across 29 cities.
2019 BLS Actual
$67,406
2025 BLS Actual
$93,332
2026 Current Est.
$98,270
2019–2027 Growth
+53.5%
Salary Trajectory for Radiologic Technologists and Technicians in Connecticut (2019–2027)
2019–2025: actual BLS OEWS data for this metro area. 2026+: CAGR 5.29% projection.
| Year | Annual Salary | Status |
|---|---|---|
| 2019 | $67,406 | Actual |
| 2020 | $71,602 | Actual |
| 2021 | $75,149 | Actual |
| 2022 | $73,505 | Actual |
| 2023 | $82,301 | Actual |
| 2024 | $89,262 | Actual |
| 2025 | $93,332 | Actual |
| 2026(current) | $98,270 | Estimated |
| 2027 | $103,468 | Projected |
Based on 7 years of BLS OEWS data for the Connecticut metropolitan area, the median radiologic technologist and technician salary grew 38.5% from $67,406 (2019) to $93,332 (2025). At a 5.29% compound annual growth rate, salaries are projected to reach $103,468 by 2027 — a total increase of $36,062 (53.50%) from 2019.
Note: Historical values (2019–2025) are actual BLS OEWS figures for the Connecticut metropolitan area, sourced from annual Occupational Employment and Wage Statistics surveys. 2026–2026 figures are current estimates, and 2027 values are projections, calculated using a 5.29% CAGR derived from 7-year BLS historical data. Actual salaries may vary based on employer, experience, certifications, and local market conditions.
Top 5 Highest Paying Cities in Connecticut
Lowest Paying Cities in Connecticut
| City | Median Salary |
|---|---|
| Waterbury | $91,128 |
| West Hartford | $92,760 |
| Shelton | $93,013 |
| East Hartford | $93,414 |
| Hartford | $95,045 |
Best Value Cities for Radiologic Technologists and Technicians in Connecticut
When adjusted for local cost of living, these Connecticut cities offer the most purchasing power for radiologic technologists and technicians.
| City | Nominal Salary | CoL Index | Adjusted Salary |
|---|---|---|---|
| Norwich | $100,089 | 100.445 | $99,646 |
| Bridgeport | $105,237 | 106.864 | $98,478 |
| New Haven | $101,552 | 104.559 | $97,124 |
| Stamford | $103,828 | 107.9 | $96,226 |
| Danbury | $103,036 | 107.9 | $95,492 |
Adjusted salary = nominal salary × (100 / CoL index). CoL index: 100 = national average. Lower index = lower cost of living.
Salary by Experience Level in Connecticut
| Experience Level | Estimated Annual |
|---|---|
| Entry Level (0-2 years) | $72,141 |
| Mid Career (3-7 years) | $98,270 |
| Experienced (7+ years) | $126,477 |
Estimates based on BLS percentile data averaged across Connecticut metro areas. Individual pay varies by employer, certifications, and specialization.
All 29 Cities in Connecticut
| # | City | Median Salary |
|---|---|---|
| 1 | Bridgeport | $105,237 |
| 2 | Stamford | $103,828 |
| 3 | Danbury | $103,036 |
| 4 | New Haven | $101,552 |
| 5 | Manchester | $100,938 |
| 6 | Norwich | $100,089 |
| 7 | Norwalk | $99,607 |
| 8 | New London | $99,380 |
| 9 | Bristol | $99,290 |
| 10 | Stratford | $99,147 |
| 11 | Middletown | $99,024 |
| 12 | Meriden | $98,815 |
| 13 | Hamden | $98,489 |
| 14 | Fairfield | $98,418 |
| 15 | New Britain | $98,307 |
| 16 | Milford | $97,863 |
| 17 | West Haven | $97,824 |
| 18 | Torrington | $97,346 |
| 19 | Groton | $97,019 |
| 20 | Vernon | $96,624 |
| 21 | Glastonbury | $96,593 |
| 22 | Naugatuck | $95,910 |
| 23 | Enfield | $95,774 |
| 24 | Cheshire | $95,560 |
| 25 | Hartford | $95,045 |
| 26 | East Hartford | $93,414 |
| 27 | Shelton | $93,013 |
| 28 | West Hartford | $92,760 |
| 29 | Waterbury | $91,128 |
More Connecticut Salary Data
Hourly Rates
Explore radiologic technologist and technician hourly pay in Connecticut cities.
Entry Level
Starting salaries for new radiologic technologists and technicians.
Senior / Experienced
Top earner salaries for experienced radiologic technologists and technicians.
Explore More Radiologic Technologist and Technician Salary Data
Frequently Asked Questions
How much do radiologic technologists and technicians make in Connecticut in 2026?
What is the highest paying city for radiologic technologists and technicians in Connecticut?
How does Connecticut radiologic technologist and technician pay compare to the national average?
What is the entry-level radiologic technologist and technician salary in Connecticut?
How many radiologic technologists and technicians are employed in Connecticut?
Which Connecticut city offers the best value for radiologic technologists and technicians?
Written by Jordan Lee, RT(R), RT(TM)
Career Analyst
Jordan Lee has over 10 years of experience in radiologic technology. They specialize in mammography and work in an outpatient imaging center.
Methodology & Data Source
Statewide salary figures on this page are 2026 projections based on the Bureau of Labor Statistics Occupational Employment and Wage Statistics (OEWS) survey, May 2026 release. A 5.29% compound annual growth rate (CAGR), derived from 6-year national BLS wage trends, was applied to each metro area's reported salary to estimate current 2026 radiologic technologist and technician compensation across Connecticut. State averages are employment-weighted across 29 metro areas — larger metro areas with more radiologic technologists and technicianscontribute proportionally more to the average, producing figures that better reflect typical compensation. Individual pay varies by city, employer, certifications, and experience.
Data Sources & Methodology
Source: BLS, OEWS, 7-year dataset (–). Per-city data from annual BLS metropolitan area surveys.
2026 figures are projected from 2025 BLS data using a compound annual growth rate (CAGR) of 5.29%, derived from historical BLS wage trends for radiologic technologist and technicians (SOC 29-2034).
Compiled and verified by Jordan Lee, RT(R), RT(TM), a licensed radiologic technologist and technician with 10+ years of clinical experience. · View source data at BLS.gov